Tutorials

Tutorial summary

Tutorial Day Overview

  • 8:00am: Venue opens
  • 9:00am - 12:00pm: Morning session
  • 10:30am: Coffee break
  • 1:00pm - 4:00pm: Afternoon session
  • 4:00pm: Coffee break
Tutorial details

#1 — Comprehensive TikTok Data Collection for Computational Social Science [↑]

Time and location

9:00am - 12:00pm, TBA

Teachers

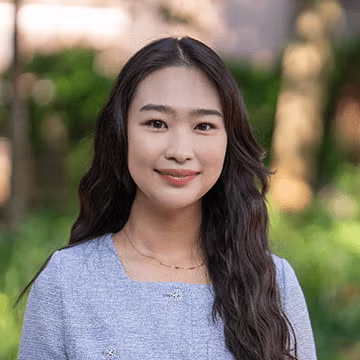
Gayoung Jeon
Gayoung Jeon

PhD student, Annenberg School for Communication, University of Pennsylvania

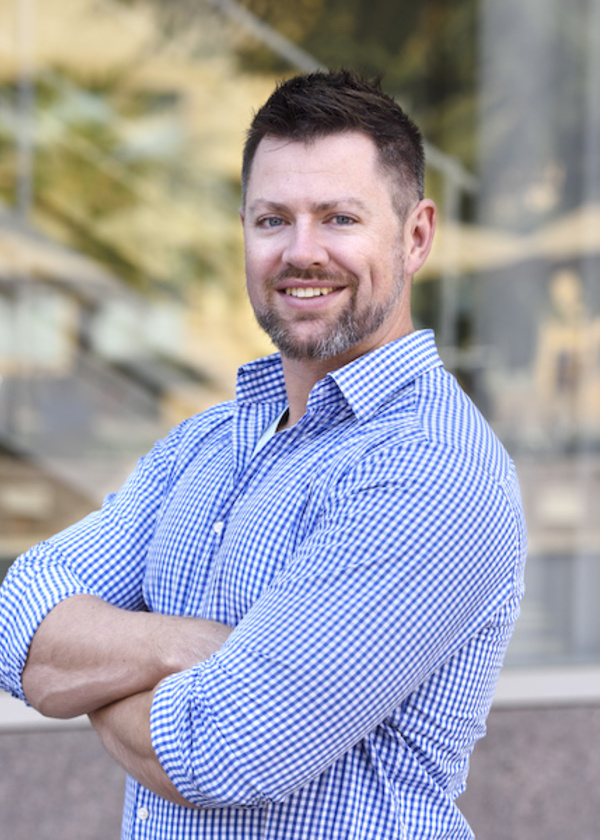
Cameron Moy
Cameron Moy

PhD student, Annenberg School for Communication, University of Pennsylvania
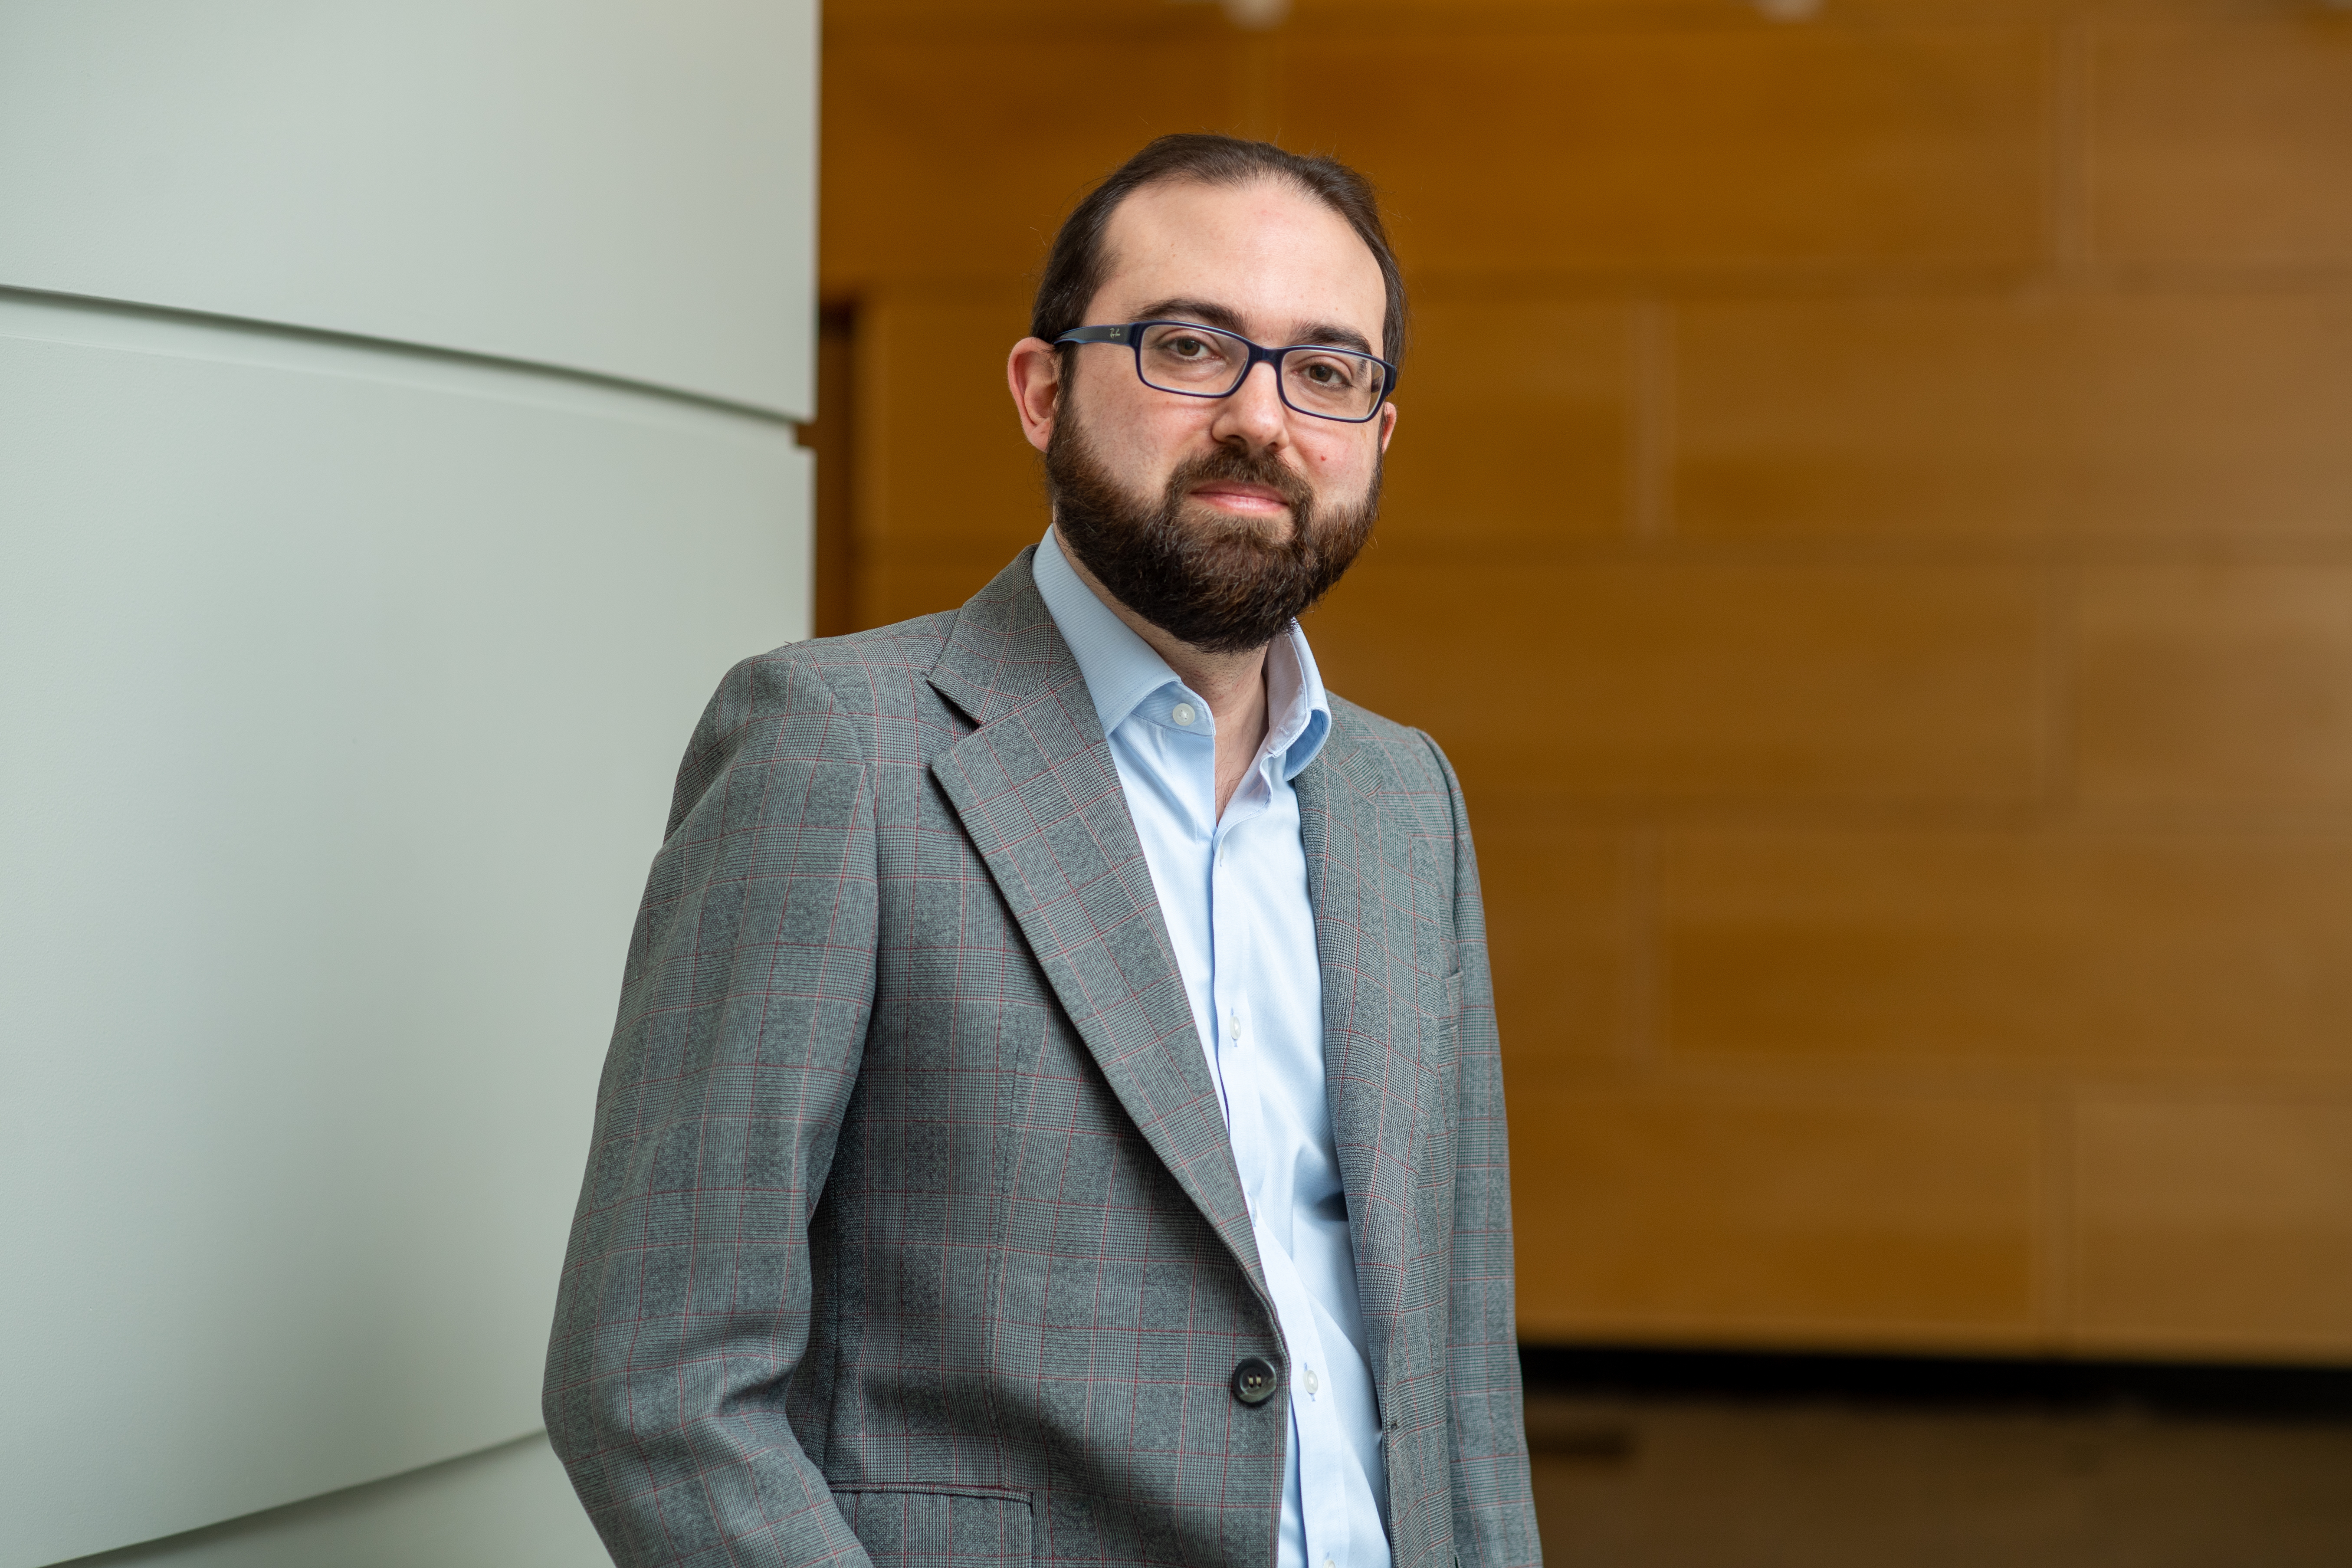
Deen Freelon
Deen Freelon

Allan Randall Freelon Sr. Professor and Presidential Professor, Annenberg School for Communication, University of Pennsylvania; Director, Politics, Identities, and Communication Lab (PICL)

Description

This hands-on tutorial provides researchers with practical tools and frameworks for TikTok data collection for Computational Social Science. Recent work systematically testing three TikTok data collection techniques reveals TikTok data collection method decisions dramatically alters research results. Participants in our tutorial will learn how to use web-scraping data collection methods (Pyktok and Apify) as well as the official TikTok Research API. This tutorial will explore best practices for data collection from three endpoints---Users, Hashtags, and Comments---using strategies identified through stress testing that: 1) Reduce algorithmic selection bias in data collection; 2) Substitute or fill missing data by combining multiple tools for a more complete dataset; and 3) Improve collection efficiency by balancing resources and dataset size (including strategies to minimize resource waste). Lastly, we introduce a checklist for reporting data collection procedures and results to increase the transparency, replicability, and generalizability of TikTok research. By engaging in this tutorial, researchers will be equipped with actionable methods to obtain high-quality TikTok datasets and decision-making criteria for optimizing collection parameters to answer empirical TikTok research questions.

#2 — Beyond APIs: Collecting Online Activity Data for Research using the National Internet Observatory [↑]

Time and location

9:00am - 12:00pm, TBA

Teachers

Pranav Goel
Pranav Goel

Postdoctoral Research Associate, Network Science Institute, Northeastern University, USA

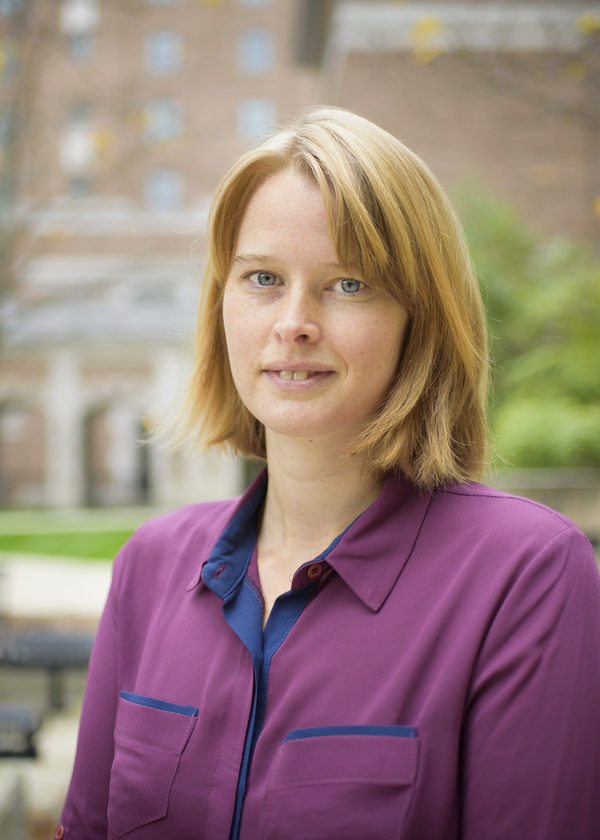
Scott Allen Cambo
Scott Allen Cambo

Senior Data Scientist and Director of Data Science, National Internet Observatory (NIO), Northeastern University

Jason Radford
Jason Radford

Research scientist with the National Internet Observatory and Director of the Social Design Lab, Northeastern University

David Lazer
David Lazer

University Distinguished Professor of Political Science and Computer Sciences, Network Science Institute, Northeastern University

Description

Learn about an alternative framework to collect online activity data for academic research, especially as we face challenges in obtaining data directly from various online platforms! This tutorial will provide a comprehensive overview of a volunteer-sourced data collection mechanism, which will help you set up your own data collection as well as apply for access to obtain data we have collected from thousands of US-based participants — cross-platform, cross-device data on the content participants are exposed to, along with survey responses, including social media and AI platforms and apps! We will gain an acute understanding of this alternative data collection mechanism as well as the data being collected by the existing setup, and learn about the research that can be conducted by such data.

#3 — Computational Tools for Measuring Collective Attention in Corpora of Text [↑]

Time and location

9:00am - 12:00pm, TBA

Teachers

Michael Arnold
Michael Arnold

Research Computing Data Engineer, Vermont Complex Systems Institute

Ben Dexter Cooley
Ben Dexter Cooley

Creative Technologist and Data Visualization Engineer, Vermont Complex Systems Institute

Jonathan St-Onge
Jonathan St-Onge

Research Software Engineer, Vermont Complex Systems Institute

Description

This tutorial introduces the "StoryWrangler" project, a platform for analyzing massive large-scale corpora such as Twitter, Wikipedia, Bluesky, Reddit, and Google Books. Despite their differences, these platforms exhibit similar heavy-tailed statistical properties, allowing consistent analytical frameworks while respecting platform-specific dynamics. We show how StoryWrangler platform implements principled measurements such as rank-turbulence divergence to detect and quantify changes in text over time. These instruments help identify when language use shifts dramatically, track the rise and fall of narratives, and compare patterns across timescales and platforms. We discuss the technical challenge of providing different levels of technical accessibility: front-end portals for visual exploration without coding, Python packages for custom analyses, and API access for large-scale studies.

#4 — Podcasts as Social Data: End-to-End Pipelines for Large-Scale Audio, Text, and Network Analysis [↑]

Time and location

9:00am - 12:00pm, TBA

Teachers

David Jurgens
David Jurgens

Associate Professor, School of Information and Department of Computer Science & Engineering, University of Michigan
Dallas Card
Dallas Card

Assistant Professor, School of Information, University of Michigan

Description

Details coming soon.

#5 — Building Multiplayer Experiments with Humans and LLM Agents [↑]

Time and location

9:00am - 12:00pm, TBA

Teachers

Bufan Gao
Bufan Gao

PhD student, Department of Psychology, University of Chicago

Xuechunzi Bai
Xuechunzi Bai

Neubauer Family Assistant Professor of Psychology and Director of the Computational Social Cognition Lab, University of Chicago

Description

Details coming soon.

#6 — Social Media Feed Ranking Algorithms: Guide to Field Experiments [↑]

Time and location

1:00pm - 4:00pm, TBA

Teachers

Martin Saveski
Martin Saveski

Assistant Professor, University of Washington

Tiziano Piccardi
Tiziano Piccardi

Assistant Professor, Johns Hopkins University

Description

Feed ranking algorithms select and prioritize what users see from a vast inventory of content on social media. They greatly impact people's opinions, moods, and actions. Typically trained to maximize user engagement (e.g., likes, replies, and reposts), feed ranking algorithms are often blamed for exacerbating negative societal outcomes, like political polarization and toxic speech online. Until recently, running feed ranking experiments and studying the effects of feed ranking algorithms was only possible from inside social media companies. However, the emergence of middleware-based feed reranking infrastructure and more customizable platforms like Bluesky have created new opportunities for experimentation. This tutorial aims to introduce participants to these new experimental opportunities and provide a practical guide for conducting feed-ranking experiments through a mix of lectures, a case study, and hands-on exercises.

#7 — Where Creativity Meets Data-Driven Stories: Building Interactive Data Visualizations in Computational Social Science [↑]

Time and location

1:00pm - 4:00pm, TBA

Teachers

Jonathan St-Onge
Jonathan St-Onge

Research Software Engineer, Vermont Complex Systems Institute

Ben Dexter Cooley
Ben Dexter Cooley

Creative Technologist and Data Visualization Engineer, Vermont Complex Systems Institute

Description

Visual data essays and dashboards are useful in drawing attention and communicating important ideas from computational social sciences to stakeholders and the broader public. Yet, what begins as a simple dataviz project often becomes increasingly hard to manage and maintain because of complexities well-known by web designers but hidden from adventurous researchers. This tutorial offers a whirlwind tour of various challenges and lessons learned from building all kinds of interactive data-driven visualizations at the Vermont Complex Systems Institute. Through concrete case studies, we discuss multiple facets of building whimsical yet robust and performant interactive dataviz in computational social science. We address data management issues, the design of interactive stories, performance, hosting on university premises, pros and cons of alternatives such as BI tools or interactive notebooks in scientific programming languages, and other considerations when deploying modern websites. We address the risk of interactive visualization rot head-on, discussing why all the hard work going into interactive dataviz can be nullified by the lack of engagement from users or disinterested stakeholders. Lastly, we briefly touch on how generative AI is currently changing the landscape of building interactive dataviz and how we use it in our own work.

#8 — Computational Research for Municipal Politics at Scale [↑]

Time and location

1:00pm - 4:00pm, TBA

Teachers

Sabina Tomkins
Sabina Tomkins

Assistant Professor, School of Information and Faculty Associate, Center for Political Studies, University of Michigan
Nic Weber
Nic Weber

Associate Professor, Information School, University of Washington

Description

Details coming soon.

#9 — An Introduction to Simulating Human Survey Responses with Large Language Models: Potentials and Pitfalls [↑]

Time and location

1:00pm - 4:00pm, TBA

Teachers

Georg Ahnert
Georg Ahnert

PhD student, Social Data Science, University of Mannheim
Maximilian Kreutner
Maximilian Kreutner

PhD student, Computer Science, University of Mannheim
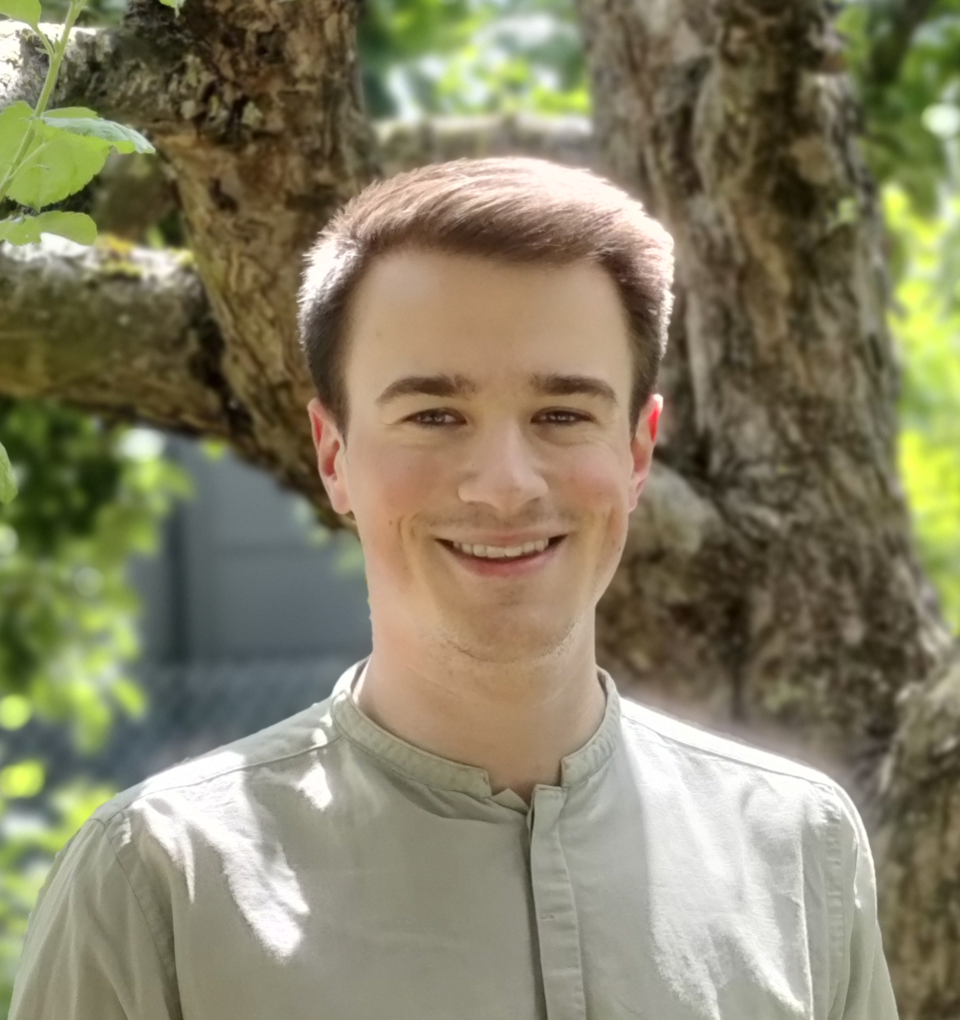
Jens Rupprecht
Jens Rupprecht

PhD student, Computer Science, University of Mannheim

Markus Strohmaier
Markus Strohmaier

Full Professor of Data Science for the Social and Economic Sciences, University of Mannheim; Scientific Coordinator for Digital Behavioral Data, GESIS—Leibniz Institute for the Social Sciences

Kristina Gligorić
Kristina Gligorić

Assistant Professor, Department of Computer Science, Johns Hopkins University

Indira Sen
Indira Sen

Junior Faculty, Business School, University of Mannheim

Description

This tutorial provides a hands-on introduction to simulating human survey responses with Large Language Models (LLMs), focusing on the methodological rigor required to use "silicon samples" to complement or extend human data. While this approach offers promise for rapid pretesting, counterfactual analysis, and enhancing statistical power through mixed-subjects designs, it introduces new methodological choices, assumptions, and risks that require careful scrutiny. To that end, this tutorial addresses analytic flexibility in silicon samples. Participants will learn to systematically explore how design decisions—such as persona construction and prompting strategies—meaningfully shift results, rather than treating LLM outputs as fixed. The tutorial introduces the QSTN framework, a tool designed to structure simulations and support transparent evaluation across design alternatives. Through guided Python exercises, participants will generate simulated responses for use cases like missing-data imputation and compare modelling choices using multiple evaluation metrics. The tutorial concludes with a critical discussion of methodological limitations, validation challenges, and ethical considerations surrounding autonomy and appropriate use cases for silicon samples. By the end of the tutorial, researchers will be equipped with a principled, transparent approach to integrating simulations into survey-centric social science workflows.

#10 — Mitigating Influence Campaigns on Social Media [↑]

Time and location

1:00pm - 4:00pm, TBA

Teachers

Gianluca Stringhini
Gianluca Stringhini

Associate Professor, Department of Electrical and Computer Engineering, Boston University

Jeremy Blackburn
Jeremy Blackburn

Associate Professor, School of Computing and Director of the Institute for AI and Society, Binghamton University
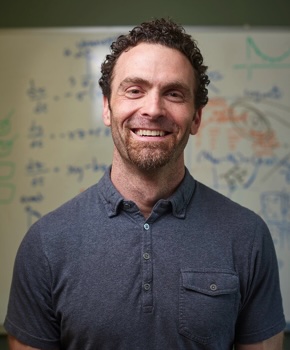
Chris Danforth
Chris Danforth

Professor, Department of Mathematics and Statistics, University of Vermont

Description

In this tutorial, we will summarize the state of the art in automated identification of fraudulent online material, highlighting recent changes associated with the increased capabilities of Generative AI. The tutorial will focus in particular on
  • the development of robust techniques to identify narratives used by previously identified inauthentic online accounts, (not only of text but also of images and videos),
  • the characteristics of narratives used by adversarial actors, with the goal of identifying future harmful narratives irrespective of the content being shared, and
  • flagging new inauthentic accounts, and learning their behavioral patterns for more effective detection.